Central Banks#
Understanding the levels and relationships between the four main macro indicators mentioned in the previous section is of particular interest to a country’s central bank.
One way to think about a central bank is that it acts as the “bankers’ bank”. Wells Fargo, Barclays, and many of the other commercial banks that we’re familiar with are regulated and overseen by a given country’s central bank. That’s just a simple way to consider it, but in practice central banks play a much larger role beyond this.
Diving deeper, a central bank is a politically-independent financial institution that is responsible for overseeing the monetary system of a country. This mainly involves doing so by setting interest rates and regulating how much money circulates throughout the economy. Central banks closely monitor and forecast the aforementioned indicators in order to carry out these responsibilities and conduct monetary policy as needed. An important feature of central banks is that they exist independently from the government, meaning the actions they take are not influenced by political pressure nor do they have to go through a congressional body to carry out their policies.
While central banks across countries differ slightly in their mandates, for the most part they share a common vision in their functions and responsibilities. For example, these include
Keeping unemployment low
Maintaining price stability while managing a healthy level of inflation
Stimulating the economy in times of recession
Overseeing the commercial banking system and serving as a lender of last resort
Carrying out economic research and statistical analysis (yay data science!)
and tHere is more in this article called the “Fed Explained”
When you hear the terms monetary policy or macroeconomic policy, you can think of it as encompassing what’s listed above. In short, monetary policy is the set of actions that a central bank takes to achieve sustainable economic growth, and much of it revolves around adjusting interest rates and the money supply.
In this chapter we’ll take a closer look at the central bank that serves the United States, known as the Federal Reserve System.
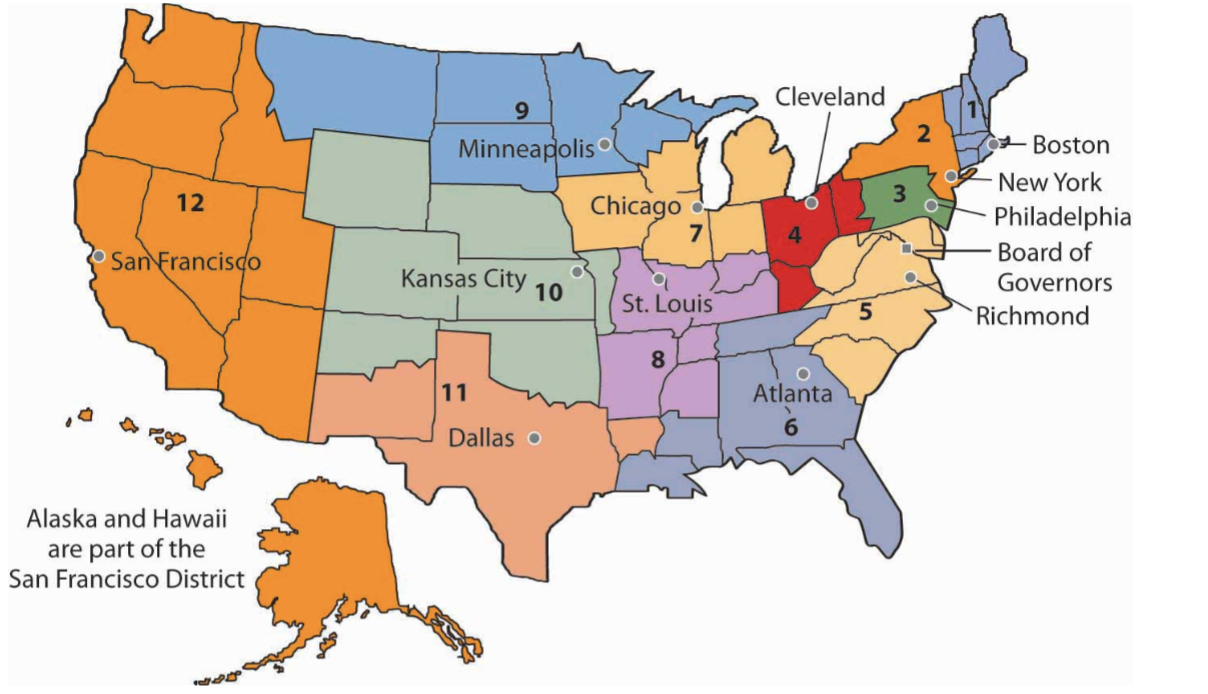
The Fed was established in 1913 to promote stability and flexibility within the United States’ monetary and financial system.Led by the Chair and the Board of Governors, the Fed is comprised of a network of 12 regional banks that serve as the operating arms of the system. Together they guide monetary policy action as well as analyze domestic and international economic conditions.
[Figure: Map of Federal Reserve Regions]

Here’s a graphic showing the locations of the 12 different regional banks. If you’re ever interested you can go take a tour of the Federal Reserve Branch in SF right on Market St!
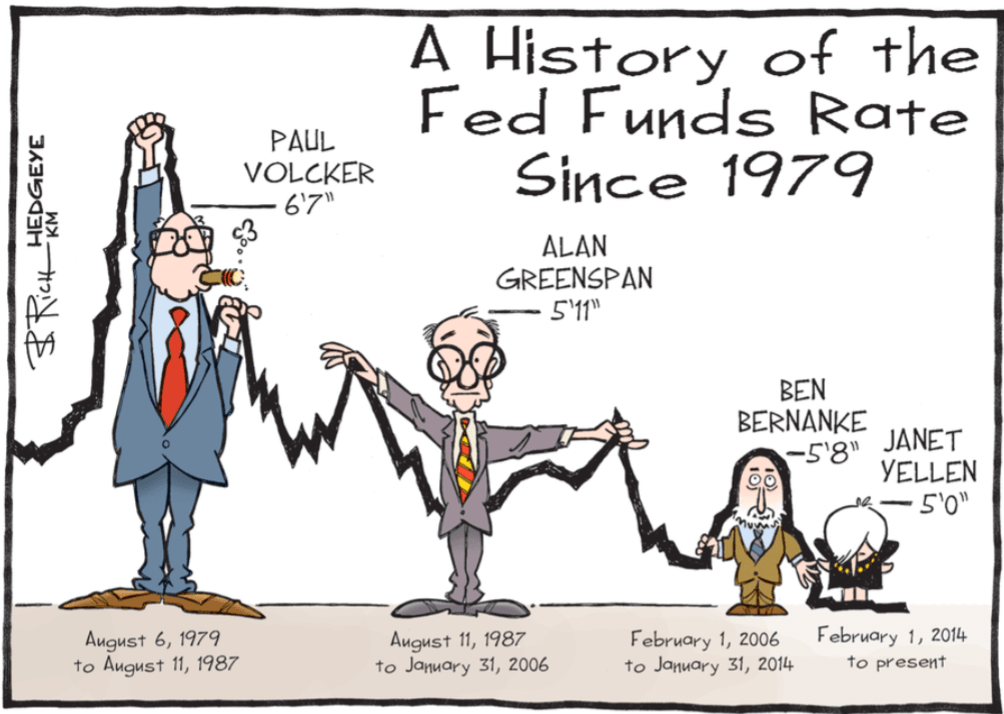
The current Federal Chairman is Jerome Powell, who you’ve probably heard about in the news lately. He’s got quite a bit on his plate with inflation running the highest it’s been in over four decades. Before him came Berkeley’s own Janet Yellen who served from 2014-2018 and was the first woman to hold the position, Ben Bernanke (2006-2014) who helped the US recover from the Great Recession, Alan Greenspan (1987-2006), the “rock star of economics, and Paul Volcker (1979-1987) who is famously known for setting incredibly high interest rates to combat high inflation in the 80s. There have been many other Chairs as well since the Fed was first established in the early twentieth century.
[Figure - cartoon of different Fed chairs, comparing their heights to interest rates in their tenure]

The Federal Funds Rate is a nominal interest rate like we discussed earlier in the chapter. Interest rates, which can be thought of as the cost of borrowing, are set low to stimulate the economy, and hiked up in times of inflation in order to “cool off” the economy. Inflation was incredibly high in the 80s after oil supply shocks in the 70s.
While these Chairs have served as the face of monetary policy throughout history, there is a lot more that goes on behind the curtains. Namely, the Federal Open Market Committee is the team of 12 economists that serves as the Fed’s monetary policy-making body, and the Chair stands as the leader of this team. The other voting members of the FOMC include the 6 other governors from the Board of Governors, the president of the New York branch, and 4 of the presidents from the 11 other regional banks.
The FOMC has 8 scheduled meetings throughout the year, at which they discuss the short and long run outlooks for the US economy as well as monetary policy options. Sometimes they have to hold emergency meetings when the situation appears to be particularly dire, for example when the coronavirus pandemic first hit, prompting a lowering of interest rates to near 0 percent.
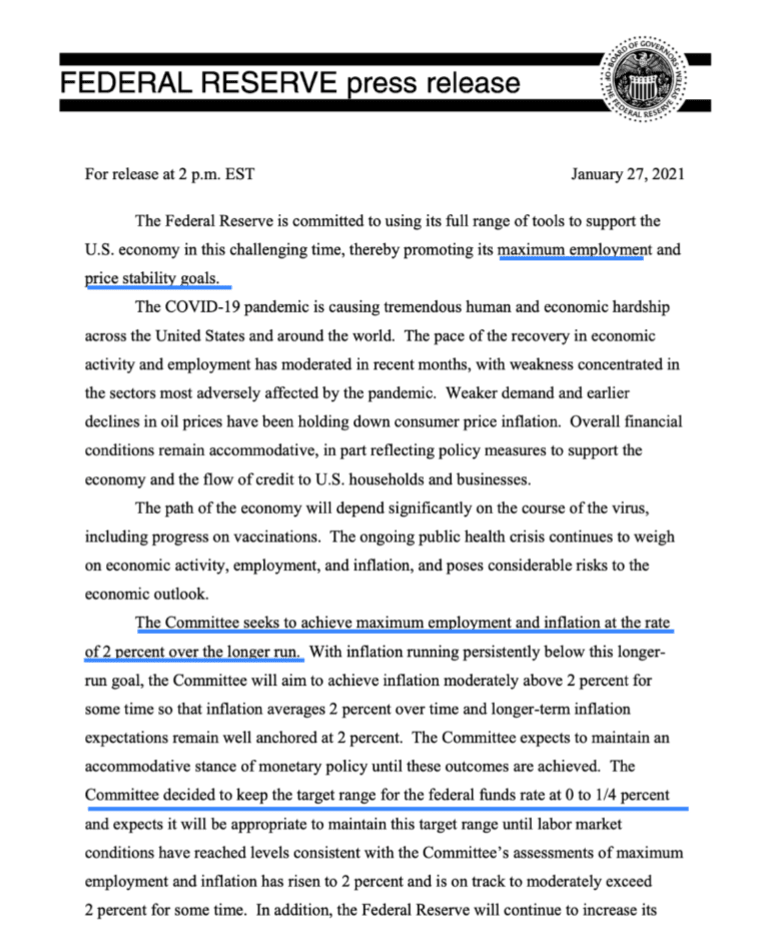
What is particularly important about these FOMC meetings is that the committee designs a course of action for staying committed to the Federal Reserve’s dual mandate and releases a statement outlining how they plan to do so. An example of this can be seen in an excerpt from the press release below,
[Figure - Graphic of a Federal Reserve press release from January 2021]

Note how the FOMC begins by describing the current state of the economy’s health in terms of the indicators that we learned about earlier in the chapter. They then outline and forecast what they plan to do in response to the situation at hand. This is important because it anchors peoples’ expectations.
Employment and inflation are particularly relevant because these are the drivers that govern how the Fed designs monetary policy actions according to their dual mandate, which is to achieve maximum employment and maintain price stability. Adjusting interest rates is directly related to reaching a delicate balance between these two goals. For example, at this snapshot of time in January 2021, the Fed wanted to keep the federal funds rate low in order to provide a boost to an economy that was experiencing “weaker demand”.
At first glance it is probably pretty confusing how all of these moving parts work hand in hand. But the intuition behind how employment, inflation and interest rates are all related to the dual mandate can best be captured by the The Taylor Rule.
The Taylor Rule was first proposed in 1993 by the American economist John B. Taylor. It’s called a “rule” because it serves as a guide to monetary policy for how to set interest rates based on the inflation gap and output gap at a given time. The equation is as follows
And these are the variables
i is the nominal interest rate (like we learned about earlier in the chapter)
The first 2% is the equilibrium interest rate. You can think of this as the ideal interest rate when production has reached its potential and inflation is stable in the long run.
\(\pi\) is the current inflation rate
The second 2% is the target inflation rate. Note how this was mentioned in the FOMC press release above! The Fed wants to have some stable inflation in the long run because that is indicative of a growing economy \(\frac{Y - Y^P}{Y^P}\) is the output gap. \(Y^P\) is the potential output if we are at full employment, so this gap tells us how far off we are from that.
The 0.5 coefficients reflect the relative balance between how much the Fed cares about inflation versus output. In the newspaper, you will often hear the terms “hawkish” or “dove-ish”. Those who support high rates to combat inflation are hawks, for example Chairman Volcker, whereas doves tend to favor lower interest rates.
In English, you can think of the Taylor Rule as a means of prescribing how nominal interest rates should adjust in response to the observed gaps. For example, the annual inflation rate as of April 2022 is currently 8.5%. Thus the Taylor Rule says that nominal interest rates should go up by
Now recall the Fisher equation that we learned about earlier the chapter, \(r_t = i_t - \pi_t\). Plugging 11.75% and 8.5% in, we see that the Taylor Rule suggests real interest rates should increase to 3.25%. Indeed, this is similar to Jay Powell’s vision as the Federal Reserve is tentatively planning to hike up rates by 0.25% - 0.5% at 6 different occasions over the course of the next year.
Another way that we can directly see how the Taylor Rule is related to the Fed’s dual mandate is to make a simplification using what is called Okun’s Law. It was proposed in 1962 by Yale professor Arthur Okun who studied the relationship between unemployment and production.
where
\(\frac{Y - Y^P}{Y^P}\) is the output gap as seen before
\((U - U^N)\) is the unemployment gap with \(U\) being the current level of unemployment and \(U^N\) being the natural rate of employment
and \(C_{okun}\) is a coefficient that represents the sensitivity of the unemployment gap to changes in the output gap
The intuition behind Okun’s Law is that the less unemployment there is, the more output that will be produced. This is because there will be more workers contributing to the country’s GDP. Thus the coefficient is negative, and empirically \(C_{okun}\) is approximately 2. By plugging Okun’s Law into our equation for the Taylor Rule we get,
Recall that the Federal Reserve’s dual mandate is to achieve maximum employment and a stable level of inflation close to their target. Therefore we can clearly see how this is captured by the Taylor Rule with Okun’s Law substituted into it. Moreover, this also illustrates how the nominal interest rate is the conventional tool that can allow the Fed to reach a balance between their two goals.
In the next section we’ll talk about some of the graphs the Federal Reserve looks at to guide their understanding of the economy and its outlook in both the short and long run.


